Saturday, March 14, 2015

Handling all variables in a workspace in R with RCaller

It is known that the R assigns a value to a variable name by using the Assignment Symbol <- which corresponds to assign function.

RCaller handles results as list objects. Since R environments are list s, they can easily be converted to R lists (Visit the previous blog post on R list here).

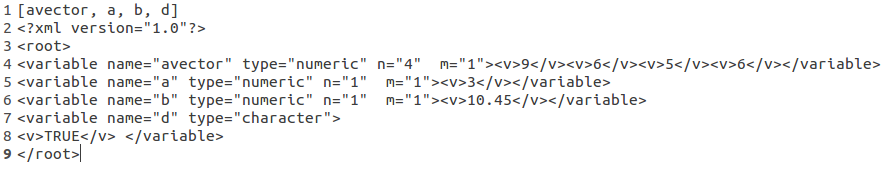
Here is an example of RCaller on getting all variables that are created in the run time in R side.


package rcallerenvironments;

import rcaller.RCaller;
import rcaller.RCode;

public class RCallerEnvironments {

    public static void main(String[] args) {
        RCaller rcaller = new RCaller();
        RCode code = new RCode();
        rcaller.setRscriptExecutable("/usr/bin/Rscript");

        code.addRCode("a <- 3");
        code.addRCode("b <- 10.45");
        code.addRCode("d <- TRUE");
        code.addRCode("avector <- c(9,6,5,6)");
        code.addRCode("allvars <- as.list(globalenv())");

        rcaller.setRCode(code);

        rcaller.runAndReturnResult("allvars");

        System.out.println(rcaller.getParser().getNames());
        try {
            System.out.println(rcaller.getParser().getXMLFileAsString());
        } catch (Exception e) {
            System.out.println("Error in accessing XML");
        }
    }

}

The output is 


As it is seen in output, created variables avector, a, b and d are returned to Java side in a single call without any manual translations.

Have a nice read!


Friday, March 13, 2015

RCaller 2.5 is available for downloading

We are happy to announce that our 'easy to use' Java library for calling R from Java is available for downloading by now on. Developers access the compiled jar file in site


 https://github.com/jbytecode/rcaller/releases/tag/2.5


This release does not extend the main functionality of the library but now there are some handy functions for performing some calculations and later development of the library.


What is new:

* Official document bibtex added to cite RCaller in any projects or papers

* RealMatrix class is implemented. Matrix operations are performed in more 'java-ish style'

* RService is implemented for developing wrapper functions


Where to start?

* Read the web page on RCaller http://mhsatman.com/tag/rcaller/
* Read blog entries in http://stdioe.blogspot.com.tr/search/label/rcaller
* Have a look at the source tree in https://github.com/jbytecode/rcaller
* Download the library in  https://github.com/jbytecode/rcaller/releases/tag/2.5

Have a nice try!


Migration of RCaller and Fuzuli Projects to GitHub

Since Google announced that they are shutting down the code hosting service 'Google code' in which our two projects RCaller and Fuzuli Programming Language are hosted.

We migrated our projects into the popular code hosting site GitHub.

Source code of these projects will no longer be committed in Google code site. Please check the new repositories.

GitHub pages are listed below:


RCaller:

https://github.com/jbytecode/rcaller


Fuzuli Project:

https://github.com/jbytecode/fuzuli


Thursday, March 12, 2015

Android Device Information Tool Application

Hello! I would like to share an Android application that can be used as a tool.

The application provides information about software of your Android device. You can find out:

-Device name
-Device ID
-Android version
-Device product
-Device manufacturer
-Device brand
-Device version
-Device host
-Device model
-Device user
-Device hardware
-Device radio version
-Device serial number
-Device finger print

If you need informations given above, you can download it from this URL.

Android Device Info App!

Monday, March 9, 2015

Nearest-Neighbor Clustering using RCaller - A library for Calling R from Java

RCaller is a software for calling R from Java. A blog post includes the latest version of downloadable jar and documentation here. The latest news can always be traced using the RCaller label in Practical Code Solutions blog.

A blog post on performing a k-means clustering analysis using RCaller is also available at this link.

In the code below, two double arrays, x and y, are created in Java side. These variables are then passed to R. In R side, distance matrix d is calculated. The R function hclust performs the main calculations. Finally, calculated heights of clustering tree and a dendrogram plot are returned to Java. The source code, output text and the returned plot are presented here:


package kmeansrcaller;

import java.io.File;
import rcaller.RCaller;
import rcaller.RCode;

public class SingleLinkageClustering {

    public static void main(String[] args) {
        RCaller caller = new RCaller();
        RCode code = new RCode();
        File dendrogram = null;

        double[] x = new double[]{1, 2, 3, 4, 5, 10, 20, 30, 40, 50};
        double[] y = new double[]{2, 4, 6, 8, 10, 20, 40, 60, 80, 100};

        code.addDoubleArray("x", x);
        code.addDoubleArray("y", y);

        code.addRCode("d <- dist(cbind(x,y))");
        code.addRCode("h&<- hclust(d, method=\"single\")");

        try {
            dendrogram = code.startPlot();
            code.addRCode("plot(h)");
            code.endPlot();
        } catch (Exception e) {
            System.out.println("Plot Error: " + e.toString());
        }

        caller.setRCode(code);

        caller.setRscriptExecutable("/usr/bin/Rscript");

        caller.runAndReturnResult("h");
        System.out.println(caller.getParser().getNames());

        if (dendrogram != null) {
            code.showPlot(dendrogram);
        }

        double[] heights = caller.getParser().getAsDoubleArray("height");
        for (int i = 0; i < heights.length; i++) {
            System.out.println("Height " + i + " = " + heights[i]);
        }
    }
}


The output is 

[merge, height, order, method, call, dist_method]
Height 0 = 2.23606797749979
Height 1 = 2.23606797749979
Height 2 = 2.23606797749979
Height 3 = 2.23606797749979
Height 4 = 11.1803398874989
Height 5 = 22.3606797749979
Height 6 = 22.3606797749979
Height 7 = 22.3606797749979
Height 8 = 22.3606797749979


The screen shot of the plotted graphics is here:


Have a nice read!