
NEWS:
2016-05-15: New Release - RCaller 3.0
2015-03-13: New Release - RCaller 2.5
2014-07-15: New Release - RCaller 2.4
2014-06-07: New Research Paper on RCaller
2014-05-15: New Release - RCaller 2.3
2014-04-15: New Release - RCaller 2.2
I have received too many e-mails since i had first submitted the early versions of the RCaller. Some users found it usable so i was planning to develop a newer and enhanced version of this library. Now, i think, it is ready for testing. The 2.0.0 version of the RCaller is downloadable from
http://code.google.com/p/rcaller/downloads/list
with both compiled jar file and the source file with the directory structure of NetBeans 7.
The use of RCaller is changed after version 1.0 but it is still easy to implement, it does not need extra libraries, it is platform independent and compatible with the recent R versions.
Some new features in version 2.0.0 are:
1) Support for plots
2) Easier code generation
3) Enhanced interaction with R
Before anything, install the R package "Runiversal" by typing
install.packages ( "Runiversal" )
in R interactive interpreter. If installation is success, you are ready for calling R from Java.
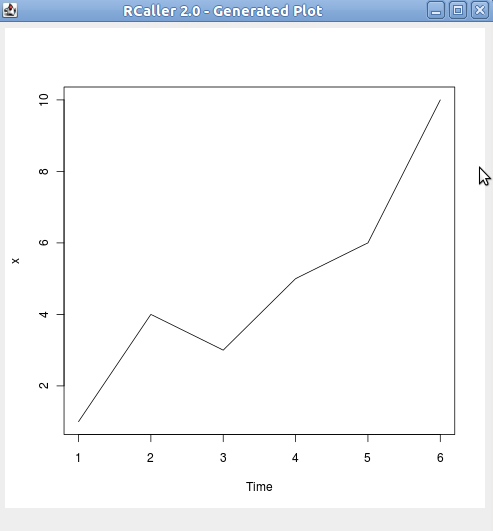
Let me explain them with some examples. Suppose that we have a double array with values of {1,4,3,5,6,10} and we want to show a time series plot with this. Firstly we import the needed libraries:
import java.io.File;
import rcaller.RCaller;
We are declaring the double array:
double[] numbers = new double[] {1,4,3,5,6,10};
Creating an object of Rcaller class:
RCaller caller = new RCaller();
RCaller needs the Rscript executable file (Rscript.exe in windows) which is shipped with the R. You must tell the full path of this file in RCaller like this:
caller.setRscriptExecutable("/usr/bin/Rscript");
This is the location of my Rscript file in my Ubuntu Linux. We didn't do much thing, but this code initializes the whole thing:
caller.cleanRCode();
the cleanRCode() function of RCaller class cleans the code buffer and puts some code in it. You can browse the source code if you want to know more about the initialization. Now, we can add our double array to our R code:
caller.addDoubleArray("x", numbers);
Now we have 'x' with the value of numbers[]. Now we are creating the time series plot:
File file = caller.startPlot();
            caller.addRCode("plot.ts(x)");
            caller.endPlot();
Finally we are sending the whole code to R interpreter:
caller.runOnly();
With this code, Rscript runs our code but it does not return anything. After all, if we have'nt got any errors, we can handle the generated image using
ImageIcon ii=caller.getPlot(file);
or we can show it directly using
caller.showPlot(file);
The generated plot is shown below:
The source code of entire example is given below:
package test;

import java.io.File;
import javax.swing.ImageIcon;
import rcaller.RCaller;


public class Test1 {

    public static void main(String[] args) {
        new Test1();
    }

    /*
     * Test for simple plots
     */
    public Test1() {
        try {
            RCaller caller = new RCaller();
            caller.setRscriptExecutable("/usr/bin/Rscript");
            caller.cleanRCode();

            double[] numbers = new double[]{1, 4, 3, 5, 6, 10};

            caller.addDoubleArray("x", numbers);
            File file = caller.startPlot();
            caller.addRCode("plot.ts(x)");
            caller.endPlot();
            caller.runOnly();
            ImageIcon ii = caller.getPlot(file);
            caller.showPlot(file);
        } catch (Exception e) {
            System.out.println(e.toString());
        }
    }
}
This example shows how to send vectors to R, call R function from Java and handle the result from Java. We are generating the x and the y vectors in Java and sending an "ordinary least squares" command to R. After running process, we handle the calculated residuals, fitted values and residuals from Java. I hope the example is clear enough to understand.
package test;

import rcaller.RCaller;


public class Test2 {

    public static void main(String[] args){
        new Test2();
    }

    public Test2(){
        try{
            //Creating an instance of class RCaller
            RCaller caller = new RCaller();


            //Important. Where is the Rscript?
            //This is Rscript.exe in windows
            caller.setRscriptExecutable("/usr/bin/Rscript");


            //Generating x and y vectors
            double[] x = new double[]{1,2,3,4,5,6,7,8,9,10};
            double[] y = new double[]{2,4,6,8,10,12,14,16,18,30};

            //Generating R code
            //addDoubleArray() method converts Java arrays to R vectors
            caller.addDoubleArray("x", x);
            caller.addDoubleArray("y", y);

            //ols<-lm(y~x) is totally R Code
            //but we send the x and the y vectors from Java
            caller.addRCode("ols<-lm(y~x)");

            //We are running the R code but
            //we want code to send some result to us (java)
            //We want to handle the ols object generated in R side
            //
            caller.runAndReturnResult("ols");


            //We are printing the content of ols
            System.out.println("Available results from lm() object:");
            System.out.println(caller.getParser().getNames());


            //Parsing some objects of lm()
            //Residuals, coefficients and fitted.values are some elements of lm()
            //object returned by the R. We parsing those elements to use in Java
            double[] residuals = caller.getParser().getAsDoubleArray("residuals");
            double[] coefficients = caller.getParser().getAsDoubleArray("coefficients");
            double[] fitteds = caller.getParser().getAsDoubleArray("fitted_values");

            //Printing results
            System.out.println("Coefficients:");
            for (int i=0;i< span="">
                System.out.println("Beta "+i+" = "+coefficients[i]);
            }

            System.out.println("Residuals:");
            for (int i=0;i< span="">
                System.out.println(i+" = "+residuals[i]);
            }

        }catch (Exception e){
            System.out.println(e.toString());
        }
    }

}
I hope it works for you.
